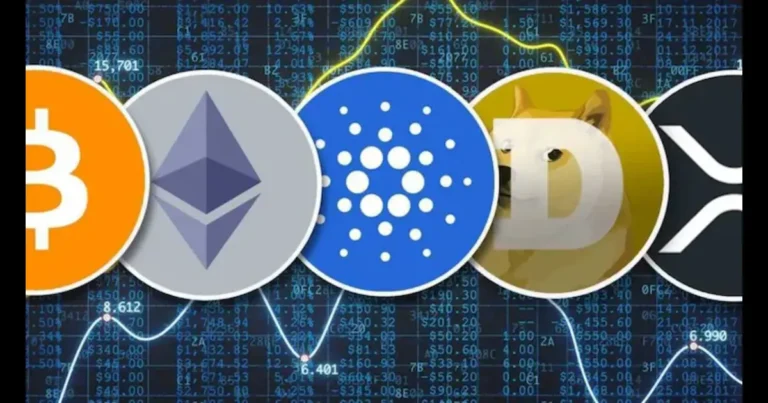
XRP Price Approaching Critical Support: A Technical Analysis Deep Dive
As the broader cryptocurrency market experiences heightened volatility, XRP, the native token of the Ripple network, is approaching a pivotal support level that could determine its short-term trajectory. Technical indicators are flashing warning signs as XRP hovers near $0.48 — a zone that has historically served as a strong support and inflection point.
A closer look at XRP’s price chart reveals a descending triangle pattern forming on the daily timeframe. This bearish structure often suggests continuation to the downside if support is breached. The base of the triangle aligns with the $0.48 mark, which has seen strong buyer interest since early Q2 2024. However, repeated tests of this level may be weakening its strength.
Momentum indicators like the Relative Strength Index (RSI) have slipped below 40, suggesting increased bearish pressure. The Moving Average Convergence Divergence (MACD) is also in negative territory with a widening gap between the MACD and signal lines — often an early sign of further downside.
On-chain data adds more context. Whale activity has decreased, and social sentiment around XRP has dipped significantly, according to data from Santiment. Meanwhile, Ripple’s ongoing legal entanglement with the SEC continues to cast a shadow over investor confidence, further dampening bullish prospects.
If XRP breaks below the $0.48 support, the next major level lies around $0.42. Conversely, a bounce here could lead to a rally back to $0.55 or higher, particularly if positive news emerges from Ripple’s regulatory battles or broader market sentiment improves.